Thursday, January 4, 2018

LINUX Server Performance

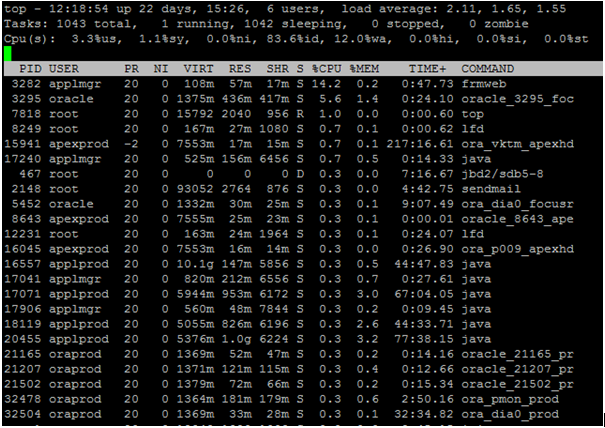
Managing performance on Linux systems can be made easier with a few commands. Learn how to use five commands: top, vmstat, iostat, free, and sar to manage performance on your Linux server.

Managing performance on Linux hosts is often seen as a black art. Many system administrators rarely venture beyond the simple or resort to throwing hardware, more memory and more CPU, at perceived performance problems. The use of a few simple commands, however, can reveal a huge amount of detail about your host and may help you resolve your performance issues quickly and easily.


1. top
The first stop for many system administrators, the top command shows the current tasks being serviced by the kernel as well as some broad statistical data about the state of your host. By default, the top command automatically updates this data every five seconds (this update period is configurable).

The top command is also incredibly fully featured (albeit that no one uses half the features available). The keystroke you should start with first is h, for "Help" (the man page is also excellent). The help displayed quickly shows that you can add and subtract fields from the display as well as change the sort order. You can also kill or nice particularly processes using k and r respectively.
The top command shows the current uptime, the system load, the number of processes, memory usage and those processes using the most CPU (including a variety of pieces of information about each process such as the running user and the command being executed).


2. vmstat

The vmstat command gives you a snaptop of current CPU, IO, processes, and memory usage. Like the top command it dynamically updates and can be executed like:
$ vmstat 10
Where the delay is the time between updates in seconds, here 10 seconds. The vmstat command writes the results of the check until terminated with Ctrl-C (or you can specify a limit on the command line when vmstat is executed). This continuous output is sometimes piped by people into files for trending performance but we'll see some better ways of doing that later in this tip.

The first columns show processes - the r column is the processes waiting for run time and b column is any processes in uninterruptible sleep. If you have a number of processes waiting here that means you've probably got a performance bottleneck somewhere. The second columns show memory: virtual, free, buffer and cache memory. The third columns are swap and shows the amount of memory swapped from and to the disk. The fourth columns are I/O and show blocks received and sent to block devices.
The last two columns are show system and CPU related information. The system columns show the number of interrupts and context switches per second. The CPU columns are particularly useful. Each column entry shows a percentage of CPU time. The column entries are:
us: The time spent running user tasks/code.
sy: The time spent running kernel or system code.
id: Idle time
wa: The time spent waiting for IO
st: Time stolen from a virtual machine.
The vmstat is good for seeing patterns in CPU usage although remember each entry is generated depending on the delay and that short term CPU monitoring may tell you little about actual CPU problems. You need to see long term trending (see below) to get true insight into CPU performance.

3. iostat

The next command we're going to look at is iostat. The iostat command (provided via the sysstat package on Ubuntu and Red Hat/Fedora) provides three reports: CPU utilization, device utilization, and network file system utilization. If you run the command without options it will display all three reports, you can specify the individual reports with the -c-d and –h switches respectively.

In the above image you can see two of these reports, the first is CPU utilization, breaks the average CPU into category by percentage. You can see user processes, system processes, I/O wait and idle time.
The second report, device utilization, shows each device attached to the host and returns some useful information about transfers per second (tps) and block reads and writes and allows you to identify devices with performance issues. You can specify the -k or -m switches to display the statistics in kilobytes and megabytes respectively rather than blocks, which might be easier to read and understand in some instances.
The last report, not pictured, shows similar information to the device utilization report, except for network mounted filesystems rather than directly attached devices.


4. free

The next command, free, shows memory statistics for both main memory and swap.
You can also display a total memory amount by specifying the -t switch and you can display the amounts in bytes by specifying the -b switch and megabytes using the -m switch (it displays in kilobytes by default).
Free can also be run continuously using the -s switch with a delay specified in seconds:
$ free -s 5
This would refresh the free command's output every 5 seconds.


5. sar

Like the other tools we've looked at sar is a command line tool for collecting, viewing and recording performance data. It's considerably more sophisicated than all the tools we've looked at previously and can collect and display data over longer periods. It is installed on Red Hat and Ubuntu via the sysstat package. Let's start by running sar without any options and examining the output:
$ sar


Here we can see the sar command's basic output, CPU statistics for every 10 minutes and a final average. This is drawn from a daily statistics file that is collected and rolled every 24 hours (the files are stored in the directory /var/log/sa/ and named saxx where xx is the day they were collected). Also collected are statistics on memory, devices, network, and a variety of others metrics (for example use the -b switch to see block device statistics, the -n switch to see network data and the -r switch to see memory utilization). You can also specify the -A switch to see all collected data.
You can also run sar and output data to another file for longer periods of collection. To do this we specify the -o switch and filename, the interval betwen gathering (remembering gathering data can have a performance impact too, so make sure the interval isn't too short) and the count - how many intervals to record. If you omit the count then sar will collect continuously, for example:
$ sar -A -o /var/log/sar/sar.log 600 >/dev/null 2>&1 &
Here we're collecting all data (-A), logging to the /var/log/sar/sar.log file, collecting every 600 seconds or five minutes continuously and then backgrounding the process. If we then want to display this data back we can use the sar command with the -f switch like so:
$ sar -A -f /var/log/sar/sar.log
This will display all the data collected whilst the sar job was running. You can also take and graph sar data using tools like ksar and sar2rrd.
This is a very basic introduction to sar. There is a lot of data available from sar, and it can be a powerful way to review the performance of your hosts. I recommend reviewing sar's man page for further details of the metrics sar can collect.
In this tip, we've seen five basic command line tools for managing and viewing performance on Linux hosts. In addition to these, it's also worth looking at tools like munin and collectd that collect data on not only performance but also on applications and services including the ability to specify your own plug-ins. Both tools support adding graphical output to the data allowing you to see a pictorial representation of your data.

Ref : http://searchdatacenter.techtarget.com/tip/Five-Linux-performance-commands-every-admin-should-know

IAS Cache initialization failed

 Today I faced an Issue in R12.2 instance. The solution I followed to overcome the issue is very simple, but they are more than one solution...